Citiverse: Virtual Worlds for Urban Systems
Header-Image Credit: Optics: crystals exhibiting interference colours by R.H. Digeon, ca. 1883.
What is the Citiverse?
Over the past few years, several technology streams that were developing independently have started to converge around a shared question: What would it mean to have a city-scale virtual environment where people can experience, test and negotiate urban futures together?
The word “Citiverse” describes this convergence. It was coined in the context of the ITU Global Initiative on Virtual Worlds and AI, launched in 2024 by the International Telecommunication Union, the United Nations International Computing Centre and Digital Dubai. The initiative defines a citiverse as a network of interconnected virtual worlds that represent and are synchronized with their physical urban counterparts, using AI, digital twins, extended reality and real-time data to address the needs of cities and their inhabitants.
What makes the concept more than a rebranding of “Smart City 2.0” is the convergence itself. While mainstream planning practice often relies on static master plans, urban theorists have actually understood cities as complex, interconnected systems for over a century and the challenge was always about finding the tools to operationalize this theory.1 Visual technology has matured from cinema to consumer-grade VR and AR. Connectivity now supports real-time synchronisation of large, multi-user environments. And AI has reached a point where it can populate virtual models with agents, generate scenarios and translate between data types that previously did not speak to each other. Individually, each of those are a tool. Together, they promise to open up the possibility of shared environments where a planner could walk through a proposed redesign, a citizen could experience what a new tram line means for their street and an energy engineer could overlay heat demand data on the same model and all at the same time.
Components of this vision are already deployed in cities like Seoul2, Helsinki3 or Zurich4 for participatory planning, risk management and infrastructure operations. But a fully integrated, city-scale Citiverse remains an ambition. What exists today is a fast-moving landscape of pilot projects, policy frameworks and international standardisation efforts laying the groundwork. On the policy side, the EU established the CitiVERSE EDIC5 in February 2024 with 14 member states and over €80 million invested and the first UN Citiverse Challenge launched in 2025.
All of this suggests that the question is no longer whether cities will build virtual counterparts, but how, for whom and under what governance conditions.
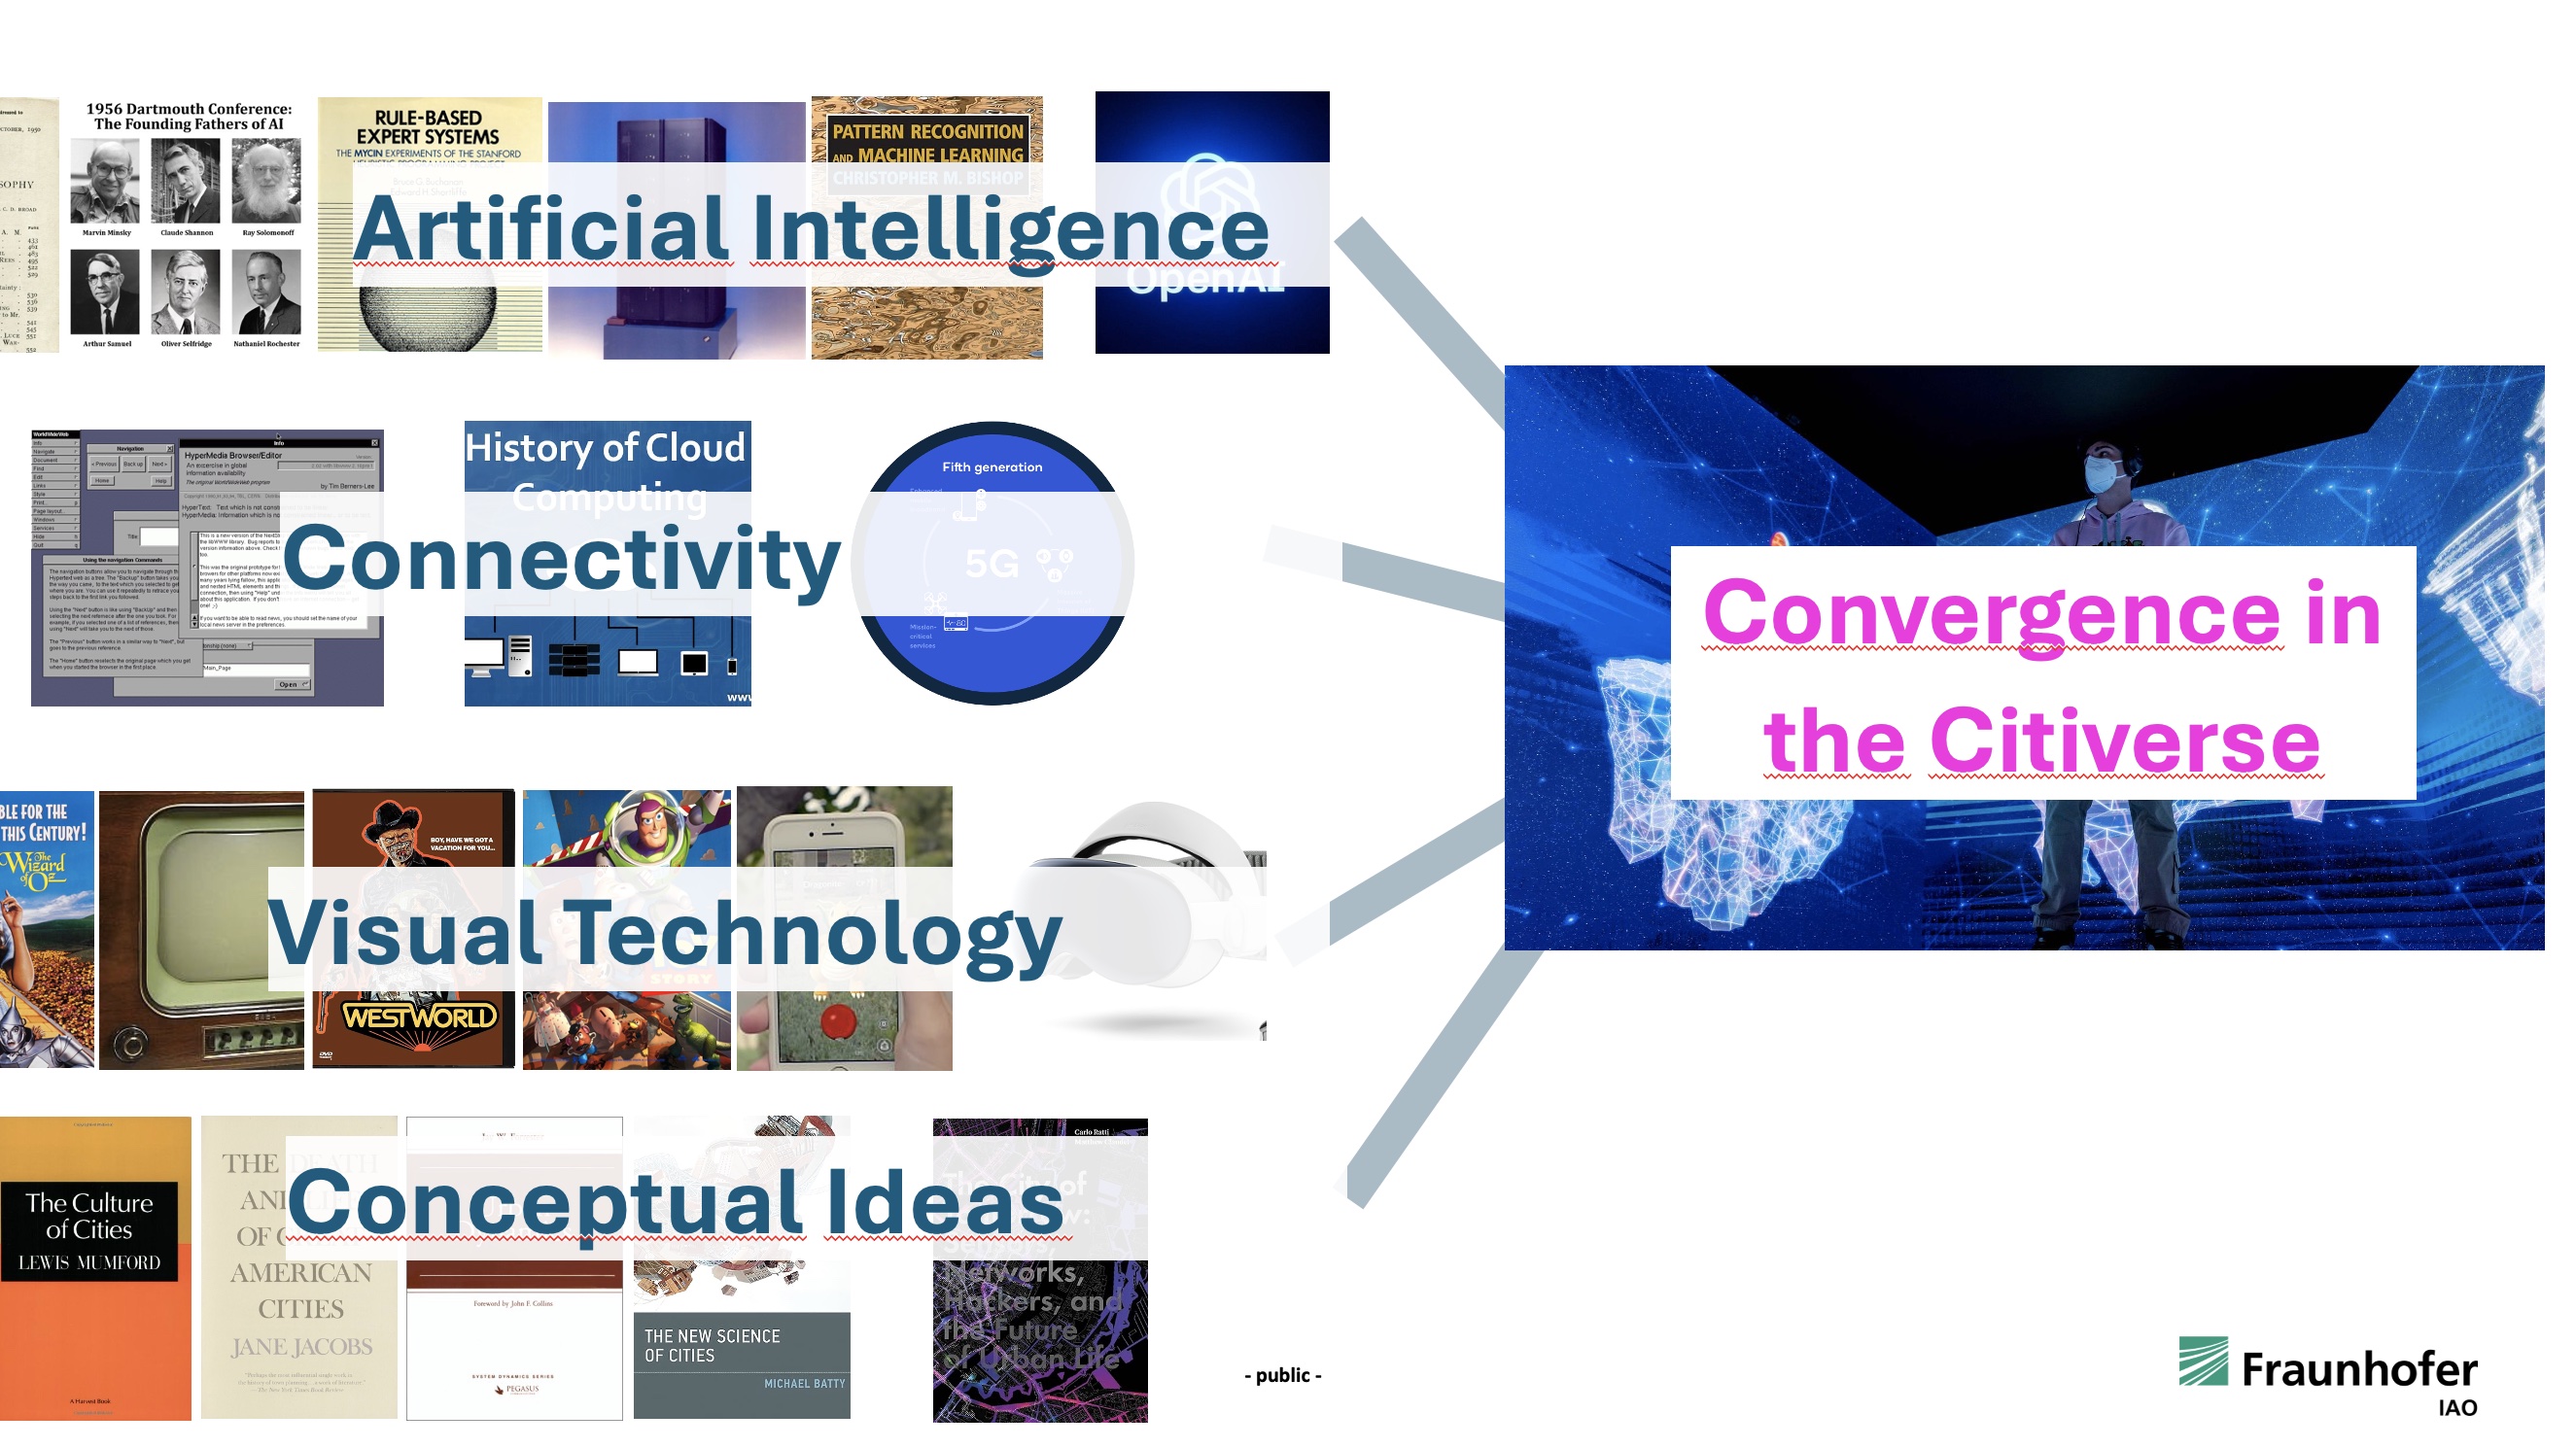 The Citiverse as convergence point of different technology and knowledge streams (slide snapshot).
Current Projects and Initiatives
I have been working on these topics from several angles at Fraunhofer IAO within the Urban Systems Engineering department.
ITU and international standardization: I contributed to the Citiverse Use Case Identification Track, one of the working groups within the ITU Global Initiative. The track developed a taxonomy of 50 urban use cases across five thematic areas, each scored for SDG alignment, scalability, impact and feasibility, and mapped along a maturity horizon from deployed to experimental. The full taxonomy and thematic reports were published in mid-2025. Fraunhofer IAO’s Steffen Braun is among the contributors. My involvement focused on the urban planning and placemaking dimensions and on connecting the taxonomy work to our applied research.
Metaverse Themenwochen at Fraunhofer IAO: I am the departmental face for the campaign “Metaverse: Vielfalt erleben, Innovation gestalten”, which brings together researchers from across Fraunhofer IAO to demonstrate how the convergence of digital twins, AI, XR and connectivity creates practical possibilities for industry, cities and people. I wrote the opening blog post for the campaign and chaired the Open Lab evening at the Zentrum für Virtuelles Engineering in March 2026, where visitors could experience VR demonstrations in our CAVE6, interact with the telepresence robot Reachy, try AI-driven co-creation tools with Hyperfy, and explore neurocognitive research setups. I have also presented on these themes in a talk titled “LListening to the City: Approaches in Bridging Complexity and Clarity”, which explored how AI foundation models might help translate between quantitative urban data and qualitative lived experience. See: Poster PDF.
The Urban Futures Teleporter: One idea that emerged from this work is a concept for a mobile, immersive VR/XR environment housed in a recycled shipping container. The Urban Futures Teleporter would allow stakeholders to virtually travel through time at a specific location in their city: To experience how their street looked in the past, how it looks today, and how it might look under different climate and development scenarios. It would build on the Morgenstadt network’s City Lab methodology and integrate multisensory elements to make abstract climate data tangible. This remains a vision, not a funded project. You can read about the concept here: Urban Futures Teleporter Vision (PDF).
Excursus: How do we measure and steer progress in a City and could the Citiverse act as possible translator?
My interest in the Citiverse is not primarily technological. It comes from a problem I have encountered repeatedly in my work on EU urban projects like URBREATH or SPARCS: The difficulty of creating shared understanding across stakeholder groups that speak different professional languages, care about different things and operate under different constraints. Imagine an urban master planning document and how e.g. an energy engineer, a local resident and a city councellor could look at the very same document while effectively seeing very different things.
The deeper I look at this, the more I ask myself the question, if one way to address these different views by looking at the relationship between the tangible and the intangible dimensions in how we understand and govern cities. Let me explain…
The tangible side is, in its simplest form, everything you can see, touch or physically measure: A building, a road surface, a cubic metre of water, a kilowatt-hour of electricity, a banknote changing hands. These things have native units of measurement, e.g SI units (metres, kilograms, degrees Celsius) or monetary units (euros, dollars) and the indicators derived from them are comparatively straightforward: E.g. Energy consumption per capita, housing cost per square metre, vehicle kilometres travelled or notably the GDP. They are trusted because they rest on quantities that, in principle, anyone can understand and are used in daily life7.
The intangible side is what a city feels like: Community cohesion, perceived safety, cultural identity, the quality of a public space, the atmosphere of a neighbourhood at night. These phenomena are real, they shape decisions, affect quality life or health, influence where people choose to live etc. - but they have no native unit. There is no SI unit for “sense of belonging” and it’s difficult to weigh social trust on a numerical scale. So the field constructed indicators to approximate them, e.g. composite indices that aggregate survey responses, proxy variables, based on behavioural data or weighted sub-scores assembled by expert panels. The resulting liveability rankings, social cohesion scores, walkability metrics, perceived-safety surveys are all attempts to give a number to something that is, by nature, not a number. They depend e.g. on subjective inputs (how safe do you feel?), methodological choices (which questions are asked, how, which indicators and sub-indicators are used, what weights are chosen, how aggregation is done etc.) and contextual judgement (e.g. “what does ‘liveability’ mean for my city/case study?”). This does makes them structurally different from the tangible side and they include more interpretations than measurements in the physical sense.
Neither side alone is enough for the full picture… The tangible can tell you how many people use a park but not whether the park feels good. The intangible can tell you a neighbourhood feels lively but cannot directly tell you how to translate this into a cost-effective maintenance scheme.
… and governing a city well means holding both together.
Here’s the catch: The tangible side has a structural advantage that goes beyond mere convention, reliability or trust. Economic and physical indicators do not just happen to dominate governance, they measure what is foundationally required. Without fiscal revenue, there is no budget for green infrastructure. Without energy supply, there is no city at all. In this sense, the tangible-economic layer is not just easier to measure, it is genuinely prior and it is the prerequisite on which everything else depends. And thus any indicator that measures prerequisites will, rationally, will receive more attention than one that measures outcomes that only become relevant once the prerequisites are met8.
This creates a structural pull: The higher up you move in a planning or governance hierarchy, the more things you need to take into account, the greater the pressure to simplify, aggregate and compare. And the greater the reliance on indicators that can turn complex, place-specific reality into a single number. GDP, energy consumption, cost per unit: These scale cleanly and easily. A city council can compare energy consumption figures across twelve districts; it cannot as easily compare how those twelve districts feel, so it needs a proxy indicator to do so.
The field’s response has been to try to close this gap from the indicator side: Developing ever more nuanced metrics that attempt to make the intangible measurable. This effort operates at two levels, and both show a similar pattern:
At the macro level, the “Beyond GDP” movement has produced over 65 distinct measurement systems, composite indices and frameworks such as the Human Development Index, the Genuine Progress Indicator, the OECD Better Life Index, Living Standards Framework and many others. Each attempting to capture what the GDP leaves out9. Yet after fifty years and several commissions like e.g. Stiglitz, Sen & Fitoussi, 2009, GDP remains the default. Because it is the only metric with a demonstrated track record of lifting populations out of poverty (Dollar & Kraay, 2002; Bergstrom, 2022)9.
At the city level, the picture is even more fragmented. My colleague Aapo Huovila analysed over 1,500 individual smart and sustainable city indicators in his dissertation at Aalto University. That number reflects the genuine and continuing effort to give value and governance leverage to the urban intangibles.
But it also raises a question I keep coming back to: Does this proliferation follow a cycle?
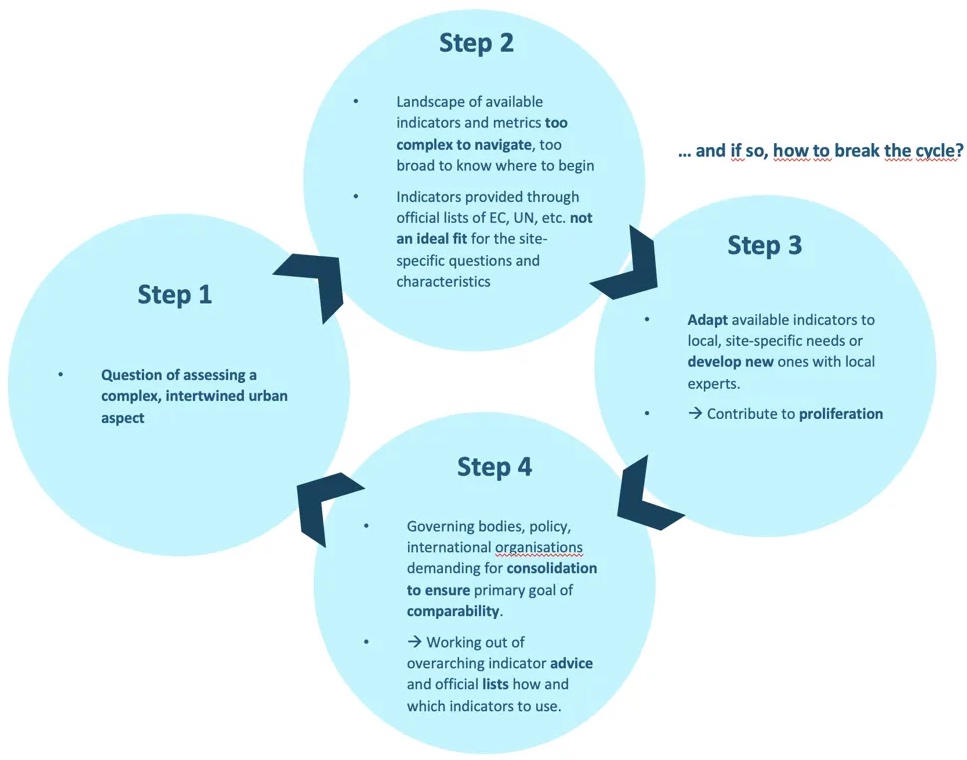
Open Question: Does a cycle like the following exist? …a complex urban question arises that existing indicators cannot adequately capture. The available standardised metrics, e.g. from official UN or EU indicator frameworks, are too broad or generic for the local context. Local practitioners develop new, context-specific indicators to fill the gap, adding to a growing total. Over time, governing bodies seek consolidation and produce new standardised lists, which in turn are again too broad for local context. The cycle restarts. Each iteration does produce useful governance tools and insights, but the overall pattern raises a question: Whether the gap between what indicators capture and what stakeholders need to understand is one that more indicators alone can close. Whether this loop exists systematically is an open question. The pattern of proliferation itself is observable10.
The indicators themselves are valuable. They have materially improved how cities set targets, allocate budgets and track progress. But adding more of them does not resolve the underlying problem: That tangible, quantitative data and intangible, qualitative experience are different kinds of knowledge, and no amount of refinement on the indicator side automatically bridges the gap between a number on a dashboard and an understanding of what that number means in a specific place, for specific people.
We would need a better translator between the two different worlds of tangible and intangible. Could the Citiverse be just this?
To me, the Citiverse idea suggests is a possible solution of this tension by creating better understanding for the intangible side and a sort of translation between the intangibles and the tangibles.
So, e.g. instead of only reading a table about urban heat at individual spots in the city or looking at tempreature trend-lines with averages, in a Citiverse virtual environment you could see and maybe even sense the temperature differences in virtual reality. One could simulate a street with tree cover versus one without and you could stand at the spot and experience what a tree would do for a space in virtual reality. The data itself remains underneath, but it becomes accessible through experience rather than through expertise alone.
So in addition to hard facts like costs of planting, costs of maintenance, watering etc. you would have a sensory experience of how the local environment could possibly change for a better.
I do not want to overstate where we are. Most of what I have described is either common-sense, early-stage, experimental or still conceptual. The technology is advancing fast. Questions about governance, data privacy, equity of access and the risk of immersive manipulation are largely unanswered. And there is a real danger that the Citiverse becomes just another layer of complexity rather than a bridge through it.
But the underlying question feels right to me:
How can we build tools that help people across different backgrounds arrive at a shared, experience-based understanding of their city. A solution that includes both the things we can count and the things that count but cannot easily be counted?
That is what interests me :)…
Worth reading
A few recent publications that I found particularly interesting:
-
Zheng et al. (2025): “Urban planning in the era of large language models.” Nature Computational Science. Tsinghua and MIT Senseable City Lab argue that LLMs can fundamentally change how we plan cities, from spatial cognition to simulated community engagement. DOI: 10.1038/s43588-025-00846-1
-
Xu et al. (2025): “Using human mobility data to quantify experienced urban inequalities.” Nature Human Behaviour. Shifts the measurement of urban inequality from where people live to where they actually go. A interesting example of what becomes visible beyond conventional indicators. DOI: 10.1038/s41562-024-02079-0
-
Zhang et al. (2024): “Urban Foundation Models: A Survey.” KDD 2024. The first systematic definition of Urban Foundation Models. Essential for understanding the technical landscape underneath the Citiverse idea and how language, vision, time-series and multimodal urban data converge in a single model architecture. DOI: 10.1145/3637528.3671453
-
Stojanovic et al. (2026): “Blind spots and actionable insights for urban governance of the climate-biodiversity-health nexus.” npj Urban Sustainability. Documents the problem this page discusses: How sectoral silos, fragmented targets and soft governance tools create blind spots in urban policy, even when the data is technically available. DOI: 10.1038/s42949-026-00345-w
-
Sanchez et al. (2024): “The Ethical Concerns of Artificial Intelligence in Urban Planning.” Journal of the American Planning Association. AI ethics in one of the top planning journals and a counterweight to the enthusiasm: What happens when these tools meet real governance, real bias, real power asymmetries?
-
Coyne, R. (2025): AI and Language in the Urban Context: Conversational Artificial Intelligence in Cities. Routledge. Related to the “LListening to the City” idea: Coyne explores what happens when we treat cities not just as systems to be optimised but as communicative environments and what role conversational AI plays in there. DOI: 10.4324/9781003535751
Related links
- ITU Global Initiative on Virtual Worlds and AI
- Citiverse Use Case Taxonomy Overview (ITU Publication)
- ITU Citiverse Thematic Reports
- EU LDT CitiVERSE EDIC (European Commission)
- 1st UN Citiverse Challenge
- Fraunhofer IAO Metaverse Campaign
- Blog: “Das Metaverse als Schnittstelle zwischen Modell und Wirklichkeit”
Footnotes
-
Viewing the city as a complex, adaptive system isn’t a new idea, even if it took a while for everyday planning practices to catch up. Early thinkers like Patrick Geddes (Cities in Evolution, 1915) and Lewis Mumford (The Culture of Cities, 1938) were already using biological metaphors to describe urban interconnectedness. By the 1960s, Jane Jacobs famously called cities problems of “organized complexity” (The Death and Life of Great American Cities, 1961). The journey since then has largely been about developing the right tools to actually map and manage this complexity, from early computer models (like Jay W. Forrester’s Urban Dynamics, 1969) to network sciences (Michael Batty, The New Science of Cities, 2013).. with the newest devlopments in Urban Foundation Models and the Citiverse … ↩
-
Seoul: Metaverse Seoul for virtual municipal services; S-Map digital twin for environmental and urban simulation. ↩
-
Helsinki: Open-data Helsinki 3D+ platform for citizens and planners to virtually experience new urban developments. ↩
-
Zurich: Digitaler Zwilling Zürich merges 3D geospatial and BIM data to simulate climate scenarios like urban heat mitigation. ↩
-
EDIC = European Digital Infrastructure Consortium headquarter in Valencia. ↩
-
CAVE = Cave Automatic Virtual Environment, a room-sized immersive VR setup where 3D visuals are projected onto walls and floor. ↩
-
The most widely known tangible indicator is GDP itself, just because in part because what it measures is genuinely foundational: Without economic activity, there is no tax base, no public budget, no institutional capacity to pursue any other goal. developed by Simon Kuznets in the 1930s to track productive capacity during the Great Depression. Kuznets warned the U.S. Congress in 1934 that “the welfare of a nation can scarcely be inferred from a measurement of national income”. Yet GDP was quickly adopted as the global standard and has remained there ever since. And until today, GDP rests as trusted and reliable metric that actually helps developing countries and lifting people out of poverty. See e.g. Dollar & Kraay (2002) confirmed by (Dollar, Kleineberg & Kraay, 2016). Bergstrom (2022) and Jansen et al. (2024), “Beyond GDP: A review and conceptual framework.” Lancet Planetary Health, and van den Bergh (2009), “The GDP Paradox.” Journal of Economic Psychology. ↩
-
This pattern has a parallel at the individual level. Research on income and subjective wellbeing consistently finds that income is a strong predictor of life satisfaction but its explanatory power diminishes at higher levels. The Maslow Pyramid, the so called Easterlin Paradox (1974) and subsequent work by Stevenson & Wolfers (2008) have shown that what makes people satisfied at lower incomes (meeting basic needs) is not the same as what makes them flourish at higher incomes (relationships, meaning, autonomy, …). In the urban equivalent this could mean: Economic indicators carry a city far, but at a certain point, the qualities that distinguish a good city from a merely functional one are no longer captured by the tangible side alone (see also literature of Richard Florida and the creative class). ↩
-
Jansen et al. (2024) provide the most comprehensive recent review, cataloguing 65 beyond-GDP metrics (i.e. composite measurement systems), and structuring them along three dimensions: wellbeing, inclusion and sustainability. See: “Beyond GDP: A review and conceptual framework for measuring sustainable and inclusive wellbeing.” Lancet Planetary Health 8(9), e695–e705. ↩ ↩2
-
Slide from a seminar presentation. See full Presentation. ↩
